

Oct20: Updated the logic to match what I’m looking for (cumulative). Added breadth by sector for detecting rotation. Targeted first 4h of 1m candles daily in script. This will also save ALL ohlcv data for each constituent of the S&P. Let it run for a few months and take a swing at beating the market! If you find alpha, you’ll have to get off of yfinance tho as the rate limits are too low to do this.
Oct19:
This is a quick start to a machine learning trading project I’m kicking off, my third run at building a profitable model. This approach with yfinance will be difficult to use real-time for small timeframes because of the amount of querying involved, but this will at least get you the training data to prove an algorithm out.
For this project, I’m using a much different approach this time. Because the cost of the fine-grained historic data is beyond what most retail traders could even conceive paying for, I’m going to demonstrate how I plan on starting to collect sufficient data for my trading algorithm. I will leave some pieces out on how I do this that are too proprietary to give away without some thought about the impact of doing so, but I’ll show you how to get the data, and I’ll suggest other data points that I’m considering. I have one specific strategy in mind, and from my own experience, I understand what patterns my brain sees. I’m hoping to train a model to see the same fleeting pieces of alpha that I look at, and discover if it’s possible to build a model that can outperform me at doing so. Claude has captured most of my thinking and seems to understand what I’m getting at. Keep in mind that this is showing a roll up on the S&P – you could also look at other sectors such as SOX, RTY small-caps, NASDAQ growth stock, energy sector, defensives to name a few. Seeing how the constituents are moving together is great, but you can see shifts in the market by looking at sectors of the index as a whole. As a final note, please note that this looks okay to me, but I haven’t inspected the input and output data closely yet.
In the fast-paced world of trading, having access to real-time market breadth indicators can give you a significant edge. Today, we’re going to dive into a powerful Python script that calculates key market breadth indicators for the S&P 500 index. Whether you’re a day trader, swing trader, or long-term investor, these indicators can provide valuable insights into market sentiment and potential trend reversals.
What Are Market Breadth Indicators?
Market breadth indicators help traders and analysts gauge the overall health of the market by looking at the number of advancing stocks versus declining stocks, as well as the volume associated with these movements. Some key indicators include:
- Advance-Decline Line (AD Line)
- Up Volume (UVOL)
- Down Volume (DVOL)
- Volume Difference (VOLD)
- Volume Ratio (VOLD Ratio)
These indicators can signal whether a market move is supported by a broad base of stocks or just a few heavy hitters, helping you make more informed trading decisions.
The Python Script
Our Python script leverages the power of yfinance to fetch real-time data for all S&P 500 stocks and calculate these indicators. Here’s what the script does:
- Fetches the list of S&P 500 stocks using
pytickersymbols. - Retrieves 5-minute interval data for each stock over the past trading day.
- Calculates the number of advancing and declining stocks for each interval.
- Computes volume-based indicators (UVOL, DVOL, VOLD, VOLD Ratio).
- Outputs the results to a CSV file for further analysis.
import yfinance as yf
import pandas as pd
import numpy as np
from datetime import datetime, timedelta
import pytz
from pytickersymbols import PyTickerSymbols

def get_spx_tickers():
    stock_data = PyTickerSymbols()
    tickers = stock_data.get_sp_500_nyc_yahoo_tickers()
    return [ticker.replace('$', '') for ticker in tickers]

def get_market_open_close(date):
    ny_tz = pytz.timezone('America/New_York')
    open_time = ny_tz.localize(datetime.combine(date, datetime.min.time())).replace(hour=9, minute=30)
    close_time = open_time.replace(hour=12, minute=30)  # 3 hours after market open
    return open_time, close_time

def calculate_indicators(tickers, date):
    ny_tz = pytz.timezone('America/New_York')
    start_time, end_time = get_market_open_close(date)

    all_data = {}
    for ticker in tickers:
        print(f"Fetching data for {ticker}")
        try:
            stock = yf.Ticker(ticker)
            data = stock.history(start=start_time, end=end_time, interval="1m")
            if not data.empty:
                all_data[ticker] = data[['Open', 'High', 'Low', 'Close', 'Volume']]
            else:
                print(f"No data available for {ticker}")
        except Exception as e:
            print(f"Error fetching data for {ticker}: {e}")

    if not all_data:
        print("No data available for any ticker.")
        return pd.DataFrame(), pd.DataFrame()

    # Create a common index for all data
    common_index = pd.date_range(start=start_time, end=end_time, freq='1min')

    # Reindex all dataframes to the common index
    for ticker in all_data:
        all_data[ticker] = all_data[ticker].reindex(common_index)

    # Combine all OHLCV data
    combined_data = pd.concat(all_data, axis=1)
    combined_data.columns = pd.MultiIndex.from_product([all_data.keys(), ['Open', 'High', 'Low', 'Close', 'Volume']])

    # Calculate indicators
    indicators = pd.DataFrame(index=combined_data.index)
    price_changes = combined_data.xs('Close', axis=1, level=1).pct_change()
    volume_data = combined_data.xs('Volume', axis=1, level=1)

    indicators['Advances'] = (price_changes > 0).sum(axis=1)
    indicators['Declines'] = (price_changes < 0).sum(axis=1)
    indicators['Unchanged'] = (price_changes == 0).sum(axis=1)
    indicators['AD_Line'] = (indicators['Advances'] - indicators['Declines']).cumsum()

    # Calculate cumulative UVOL and DVOL
    uvol_per_period = volume_data[price_changes > 0].sum(axis=1)
    dvol_per_period = volume_data[price_changes < 0].sum(axis=1)

    indicators['UVOL'] = uvol_per_period.cumsum()
    indicators['DVOL'] = dvol_per_period.cumsum()
    indicators['VOLD'] = indicators['UVOL'] - indicators['DVOL']
    indicators['VOLD_Ratio'] = indicators['UVOL'] / indicators['DVOL']

    return combined_data, indicators

def main():
    tickers = get_spx_tickers()
    print(f"Number of tickers: {len(tickers)}")

    ny_tz = pytz.timezone('America/New_York')
    today = datetime.now(ny_tz).date()

    ohlcv_data, indicators_data = calculate_indicators(tickers, today)

    date_str = today.strftime('%Y-%m-%d')
    ohlcv_data.to_csv(f'spx_ohlcv_{date_str}.csv')
    indicators_data.to_csv(f'spx_indicators_{date_str}.csv')

    print(f"Data saved for date: {date_str}")
    print(f"OHLCV data shape: {ohlcv_data.shape}")
    print(f"Indicators data shape: {indicators_data.shape}")

if __name__ == "__main__":
    main()
How to Use the Script
- Install the required libraries:
yfinance,pandas,pytz, andpytickersymbols. - Copy the script into a Python file (e.g.,
spx_indicators.py). - Run the script using Python:
python spx_indicators.py. - The script will output the indicators to the console and save them to a CSV file named
spx_indicators.csv.
Interpreting the Results
The input data isn’t sanitized and looks like it might have some issues at the start. The indicators also need a row to calculate delta. The features of interest are the AD_Line, and VOLD_Ratio.
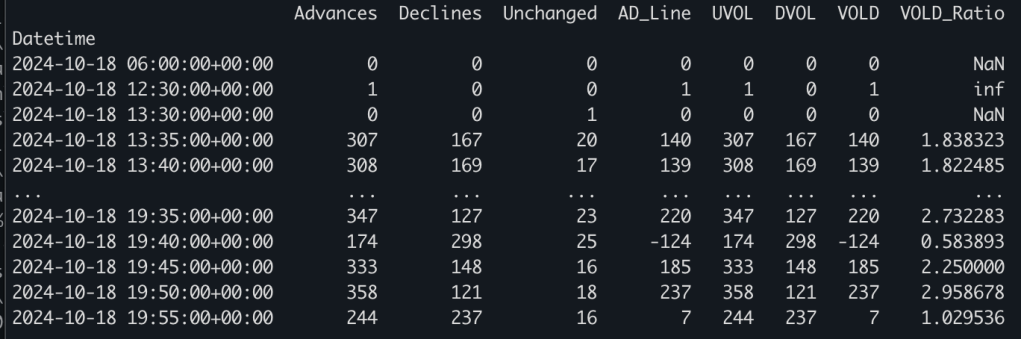
- AD Line: A rising AD Line suggests broad market strength, while a falling AD Line indicates weakness.
- UVOL vs DVOL: When UVOL consistently exceeds DVOL, it suggests bullish sentiment, and vice versa.
- VOLD: Positive VOLD indicates more volume in advancing stocks, suggesting bullish pressure.
- VOLD Ratio: A ratio above 1 indicates more volume in advancing stocks than declining stocks.
Potential Applications
- Trend Confirmation: Use these indicators to confirm the strength of market trends.
- Divergence Analysis: Look for divergences between price action and market breadth indicators for potential reversals.
- Overbought/Oversold Conditions: Extreme readings in these indicators can signal overbought or oversold conditions.
- Sector Rotation: Apply this script to sector ETFs to identify sector rotation trends.
Limitations and Considerations
- The script relies on free data from Yahoo Finance, which may have limitations in terms of data accuracy and timeliness.
- Processing 500 stocks can be time-consuming and may require handling of rate limits.
- These indicators should be used in conjunction with other technical and fundamental analysis tools for best results.
Conclusion
This Python script provides a powerful tool for retail traders and quants to gain insights into market breadth. By calculating these indicators in real-time, you can stay ahead of the curve and make more informed trading decisions. Remember, successful trading is about having an edge, and understanding market breadth can be that edge in your trading arsenal.
Happy trading, and may the market breadth be with you!


Leave a comment