
//@version=5
indicator(“McClellan Oscillator”, overlay=false)
// Input for symbol – use `USI:ADV-USI:DECL` or for volume `USI:UVOL-USI:DVOL`. For VOLD ratio: `USI:UVOL/USI:DVOL`
advdecl_symbol = input.symbol(“SYMBOL HERE “, “Advance-Decline Symbol”)
// Get advance-decline data
adv_decl = request.security(advdecl_symbol, timeframe.period, close)
// Calculate EMAs
ema19 = ta.ema(adv_decl, 19)
ema39 = ta.ema(adv_decl, 39)
// Calculate McClellan Oscillator
mcclellan_oscillator = ema19 – ema39
// Plot the oscillator
plot(mcclellan_oscillator, color=color.blue, title=”McClellan Oscillator”)
// Add a zero line
hline(0, color=color.gray, linestyle=hline.style_dashed)
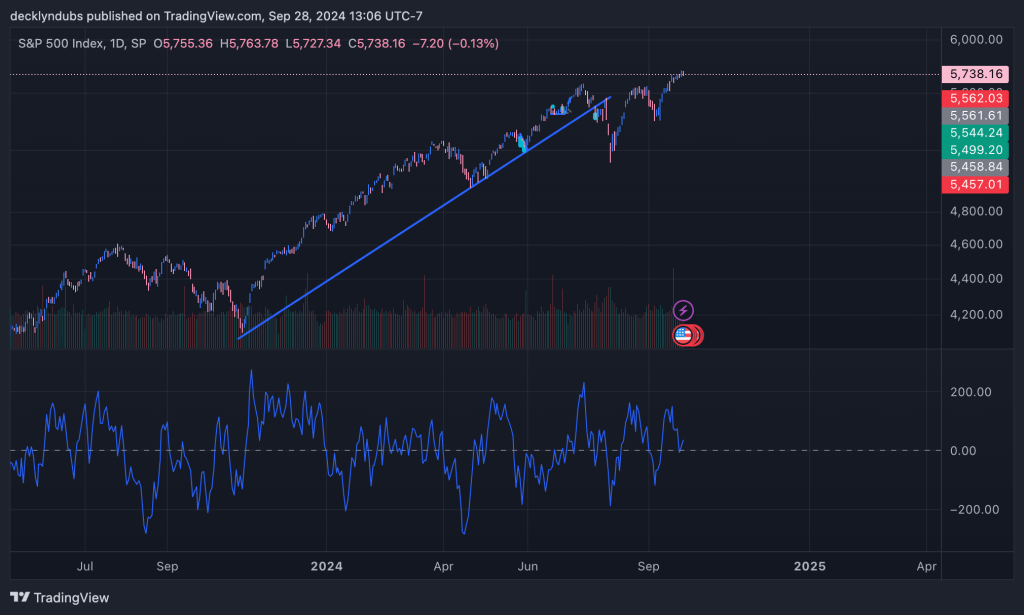
Creating and Using the McClellan Oscillator in TradingView
The McClellan Oscillator is a powerful market breadth indicator that can provide valuable insights into market trends and potential reversals. In this article, we’ll explore how to create this oscillator in TradingView using advance-decline data, and why it can be an effective tool for traders.
What is the McClellan Oscillator?
The McClellan Oscillator, developed by Sherman and Marian McClellan in 1969, is a market breadth indicator that measures the difference between two exponential moving averages of advancing and declining stocks. It helps traders gauge the overall health of the market and identify potential trend changes.
Creating the McClellan Oscillator in TradingView
To create the McClellan Oscillator in TradingView, follow these steps:
- Open TradingView and create a new indicator.
- Use the following Pine Script code:
//@version=5 indicator("McClellan Oscillator", overlay=false)advdecl_symbol = input.symbol("USI:ADV-USI:DECL", "Advance-Decline Symbol")// Calculate EMAsema19 = ta.ema(adv_decl, 19)ema39 = ta.ema(adv_decl, 39)// Calculate McClellan Oscillatormcclellan_oscillator = ema19 - ema39// Plot the oscillatorplot(mcclellan_oscillator, color=color.blue, title="McClellan Oscillator")// Add a zero linehline(0, color=color.gray, linestyle=hline.style_dashed)
- Save the indicator and add it to your chart.
This script does the following:
- Requests advance-decline data for the NYSE (you can modify this for other exchanges).
- Calculates 19-day and 39-day exponential moving averages of the advance-decline line.
- Computes the McClellan Oscillator as the difference between these EMAs.
- Plots the oscillator and adds a zero line for reference.
Why the McClellan Oscillator Works Well
The McClellan Oscillator is effective for several reasons:
- Market Breadth Insight: By using advance-decline data, it provides a broader view of market health than price-based indicators alone.
- Trend Identification: The oscillator helps identify the strength and direction of market trends. A consistently positive oscillator suggests a strong uptrend, while a negative one indicates a downtrend.
- Divergence Detection: Divergences between the oscillator and price action can signal potential trend reversals.
- Overbought/Oversold Conditions: Extreme readings can indicate when the market is overbought or oversold, suggesting potential reversal points.
- Momentum Shifts: The crossing of the zero line can signal shifts in market momentum.
- Leading Indicator: The oscillator often leads price action, providing early signals of potential trend changes.
How to Use the McClellan Oscillator
- Trend Confirmation: Use positive readings to confirm uptrends and negative readings for downtrends.
- Divergences: Look for divergences between the oscillator and price action. For example, if prices are making new highs but the oscillator is not, it might suggest weakening momentum.
- Zero Line Crossovers: When the oscillator crosses above the zero line, it’s a bullish signal. Crossing below is bearish.
- Extreme Readings: Values above +70 or below -70 often indicate overbought or oversold conditions, respectively. These can signal potential reversals.
- Combine with Other Indicators: Use the McClellan Oscillator in conjunction with other technical indicators for more robust trading signals.
Conclusion
The McClellan Oscillator is a versatile tool that provides valuable insights into market breadth and potential trend changes. By implementing it in TradingView, traders can leverage its power to make more informed decisions. Remember, while it’s a powerful indicator, it should be used as part of a comprehensive trading strategy, not in isolation.
BONUS: VOLD RATIO OSCILLATOR for market bottoms
I noticed applying the oscillator to VOLD ratio (UVOL/DVOL) that it can be highly predictive of the market bottom in a downturn. If it hits 1.2, it’s probably time to get long. Some study of market downturns vs my spin: K-Xs VOLD Oscillator:


Leave a comment