
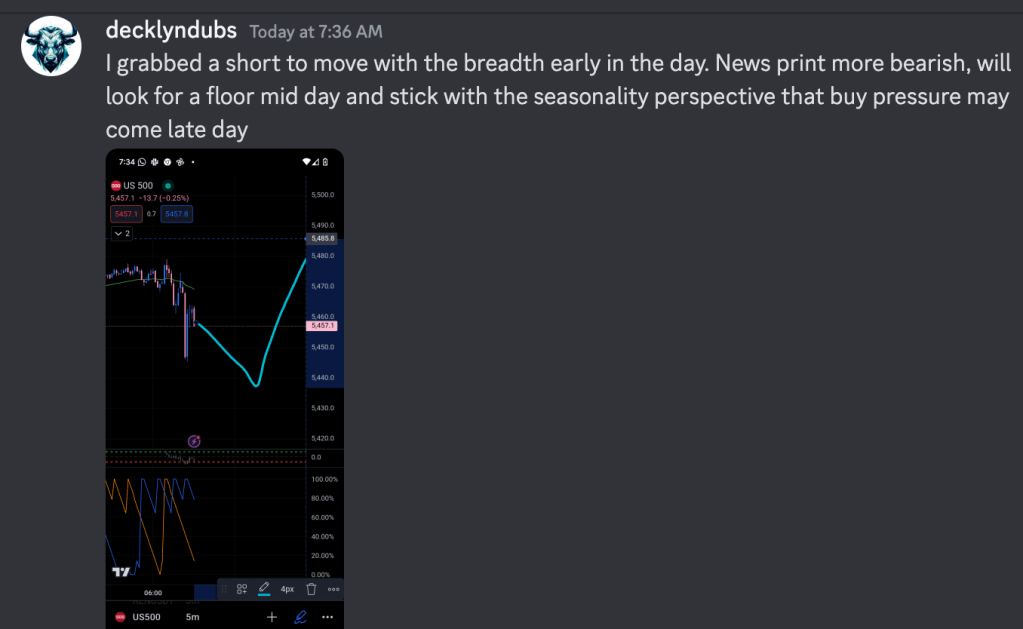
Day 1 trying to add intraday seasonality as a signal. I traded S&P. I took two trades and closed them both green. I got about 70% of the daily range I’m guessing. PMI came in during the market session and I read it as bearish for rate cut probability due to some inflationary pressures.
You can see a screenshot late day with the forecast beside the market moves:

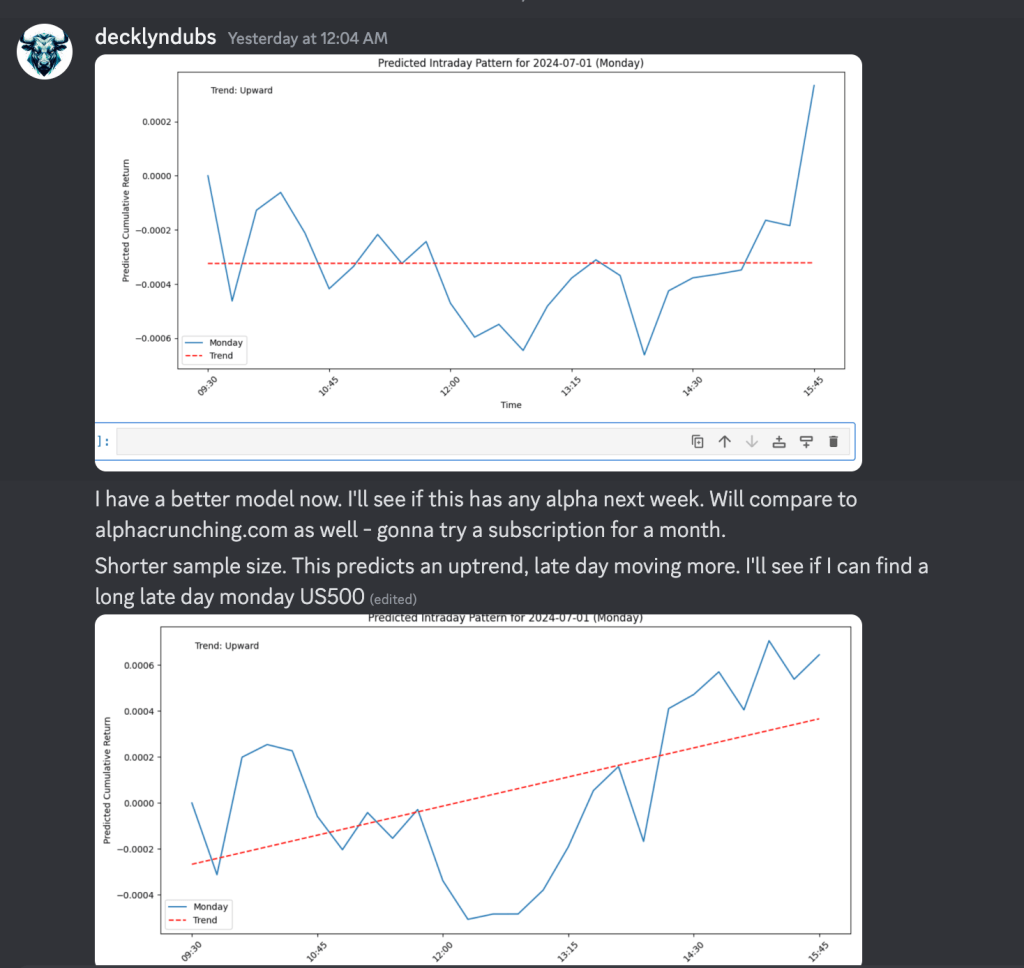
The intraday seasonality charts I was using were made from a shorter sample of data and a longer sample, to give a couple perspectives. It’s not a silver bullet and it still takes a lot of analysis to find safe trades, even on a day it maps quite well.
You can see my prep work from the night before:
Roughly I was expecting sell pressure towards noon, and a reversal/floor for the day around that time. Late day looked like it might present a long opportunity, so I was focusing there. In the morning, the PMI print came in bearish, and that matched the seasonality forecast, so I took a short position on retracement after the data came in.

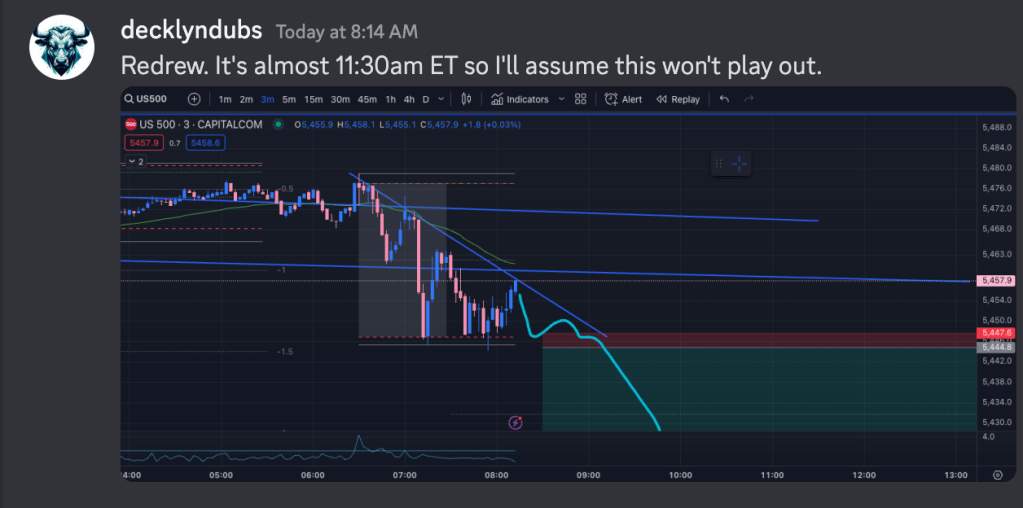
I exited, and I saw a setup for a further breakdown, but it didn’ meet my criteria for entry so I skipped this trade as we hit 8:30am PT/11:30am ET which is my “reset button” if the day isn’t a trend day.
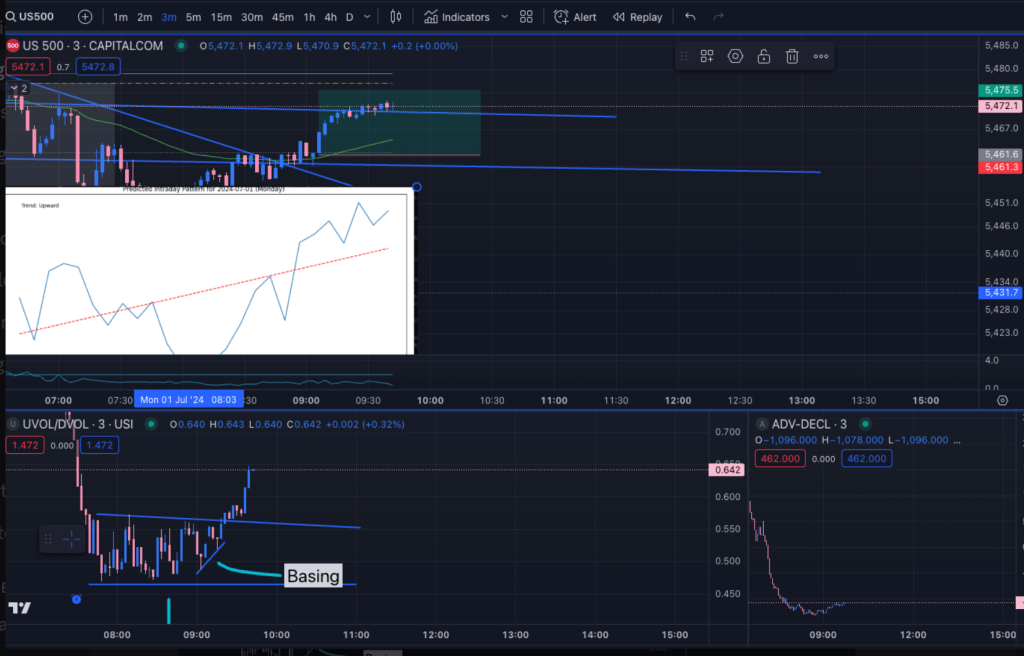
I did take one trade into late day, and I really think that DR floor would have been a nice safe long to take but I didn’t catch the long until I saw confirmation of a trend change. The signals that lined up to get me in this trade were as follows:
- Intraday seasonality gives an expectation for upside after noon et. I entered just after noon.
- VOLD was basing up, saw some support from breadth. Advance decline was basing.
- On the chart there was a break up on the descending wedge. I longed on retest for a very safe, clean entry.
Often times I have a bearish bias, so the intraday seasonality chart gives me enough conviction to get me betting long.
A couple notes:
- Late Entries: The trades were low stress, entries were very late. The setup I skipped I avoided losses by waiting for the last possible second to enter, once the move is underway. This curbs over-trading – I should double check it’s in my checklist.
- Macro First: The most important catalyst in the day was the PMI data. The daily range was set by the catalyst, and it was tradable today. I rushed to analyze the data – it’s a race against the clock to compete for that alpha, and I didn’t skimp. I read the reports as they came in, and when I got the messages out of it, I was lucky to find a retest and a short. The seasonality data gave conviction, because I was expecting downturn there. If the macro didn’t line up with the seasonality data, I probably would have avoided trading the data as the market will often against logic, especially before documents like CPI that are handed out to super-users early (Blackrock, JP Morgan etc – they all know before we do!)
- Chart Patterns Last: With the context from catalysts and seasonality, it seems you can make better guesses about which way patterns will break out. I saw a great short setup that never fired, I might have just faded the breakdown which would have drastically improved the gains from the long.
I’ll keep forward testing. I can use this in my trading. Even if it’s only really rough, but does point out the shape of the day, it helps with the conviction to enter and hold a good setup with weight when everything lines up. Either of these trades were fine for 10x or 20x the weight today, they had no draw down and were easy to find exit points that caught most of the move.


Leave a comment