
I certainly wouldn’t enter on this, but here is my high timeframe analysis of the S&P.

The covid crash of 2020 saw a historic shift in American Monetary policy, where fractional reserve requirements were abolished.
As announced on March 15, 2020, the Board reduced reserve requirement ratios to zero percent effective March 26, 2020. This action eliminated reserve requirements for all depository institutions. – FRED https://www.federalreserve.gov/monetarypolicy/reservereq.htm
Correlated with this shift in monetary policy was an explosion of money supply as shown in the USA M1 below.
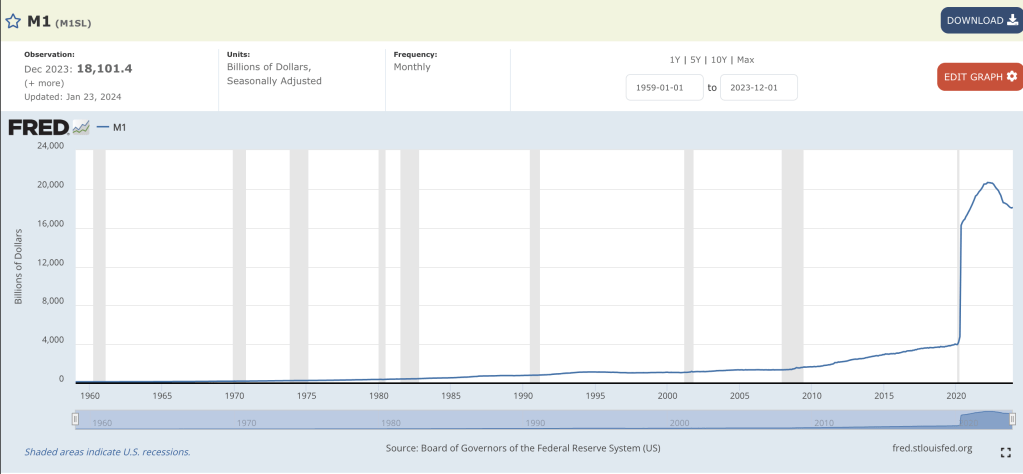
While the Federal Reserve originally anticipated inflation was transitory, this egregious increase in money supply can’t be ignored. The US money supply increased 4x nearly overnight. Coupled with stimulatory policy and helicopter money, demand increased, while supply side issues in everything from housing to automotive created a boom in virtually everything (“everything bubble.”) The rate hike cycle began once inflation began running away, and the Federal Reserve starting acting too late in tightening (so it seemed…) A boom in indices closely followed this explosion in money supply as can be seen.
The rate hiking caused a temporary halting and correction of the momentum in indices. When factoring in inflation, the S&P’s value dropped a lot more than may be visible. The below chart shows the S&P in an approximation of real dollars (S&P divided by US CPI.)

You can see that, although S&P has breached 5k and is at the all time high today (Feb 2024,) that it actually is no where near all time highs in this approximation of real dollars.
We’re nearing the start of the rate cut cycle, probably not March but the meeting after that. Historically the rate cuts are actually correlated with a drop in the S&P, so I’m anticipating about 4k S&P by the end of 2024, but you can’t predict the future.


Leave a comment