
I still have to continue to backtest this, but I’ve been on this strategy for a couple years and make significant strides on finding retracements pretty much monthly.
I’m discovering improved predictive powers by utilizing Voss with predictive volatility indicators to filter down to low volatility periods (consolidation) that precipitate large volatility expansions.
I’m finding statistically high probability reversals with a combination of outlier low BB width combined with ATR and then filtering entries with Ehler’s Voss Predictive filter. Let’s start with ATR and BB to find high probability reversals. The entries are not great, but we can identify reversals starting here;
Here is 1hr on NAS. This is actually targeting the 45m timeframe, and we look up timeframes to find confidence and confluence. I’m working on a similar strategy for the expansion side in trend in the other direction, but we’ll focus on retracements in this post. You’ll note the green circles and pink strips which are looking for statistically low ATR and BB width.
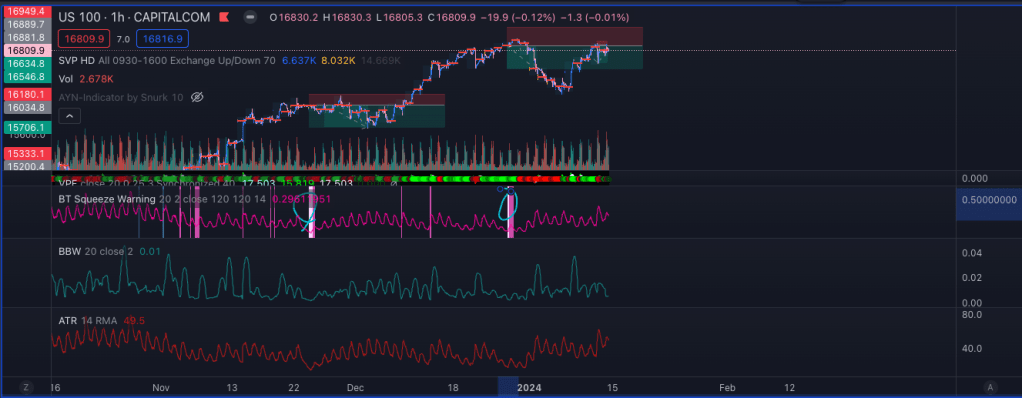
So we can anticipate the move, but we have high risk entries that hold some drawdown.
We can improve the entry point is significantly by finding the reversal point with Voss on the 4hr timeframe (1 timeframe up by the confirming timeframe). You’ll see the green circles on voss that identify the entry point after our signal.
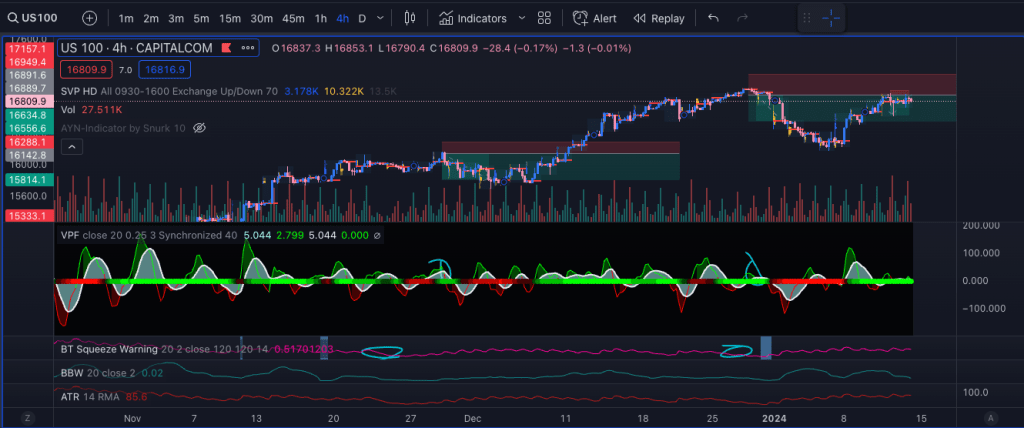
You can see that these entry points are nearly perfect and capture the entire retracement without any risk. I’ll write this strategy up next and check the winrate and drawdown.
A quick look on lower timeframes catch the volatility expansion on 5m confirmed on 15m, and Voss is able to catch each reversal as volatility increases, but these are going to be a lot more difficult to trade. You’ll note that once volatility starts to decrease the predictive signal fades again on Voss.
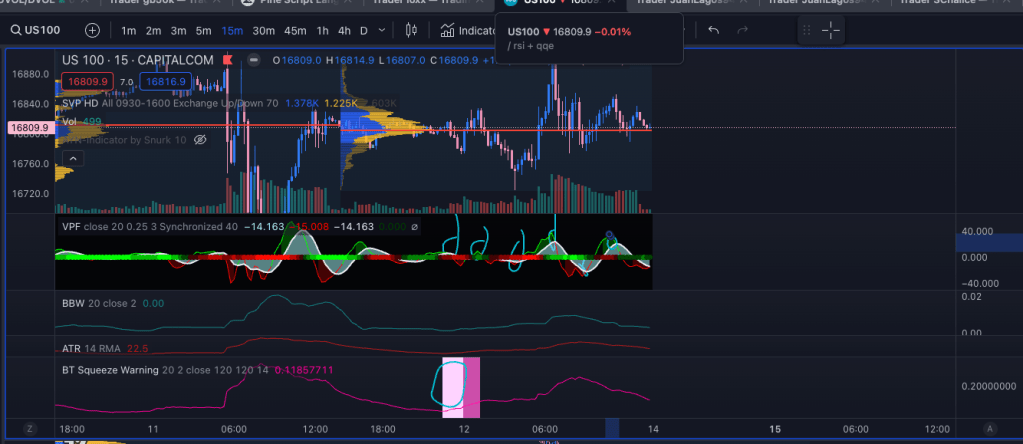
Someone asked me to advise for lower timeframes, and it appears to catch the same oscillations on 1m/5m. You can see perfect trades into a catalyst (PPI 8:30am ET January 12th.) Note that the data should be unknown, tho, so this is risky to trade into.
We’re getting closer.
Someone checked CPI as a catalyst to see if sub-second timeframes can catch more of the move and it looks pretty good:
You have look at different timeframes to understand how to catch the signals. Here are multiple sub-minute timeframes for study for CPI as a catalyst (Jan 11 8:30am ET, 2023). I’m not sure how this would play out and needs more testingas the data should only be availabe at the 8:30am candle, yet our signal here predicts the entire move early (with some drawdown…):
10s

15s:

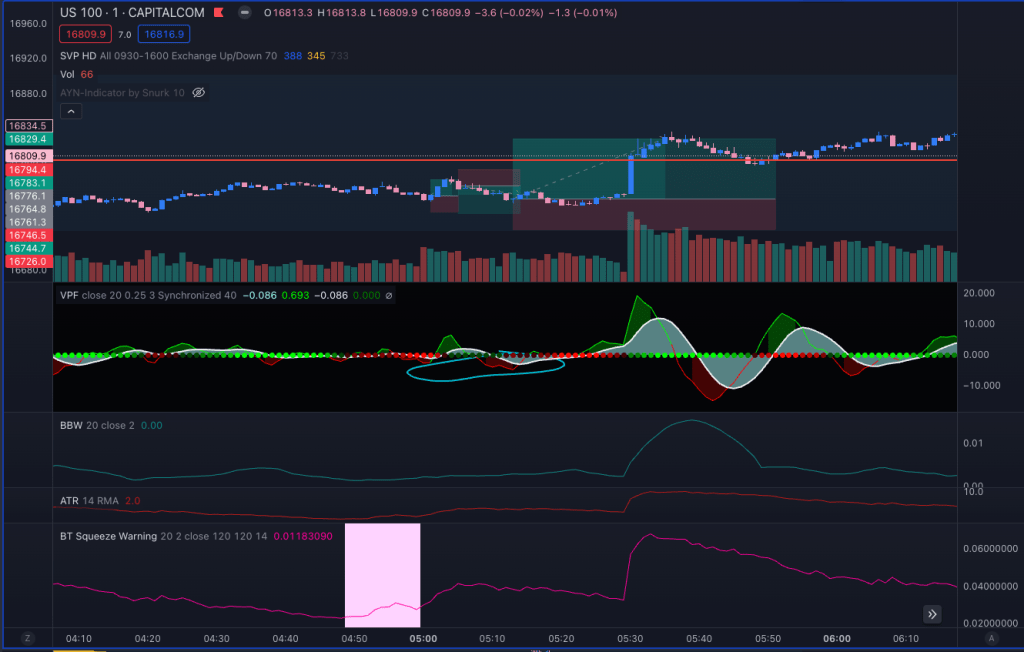
30s:
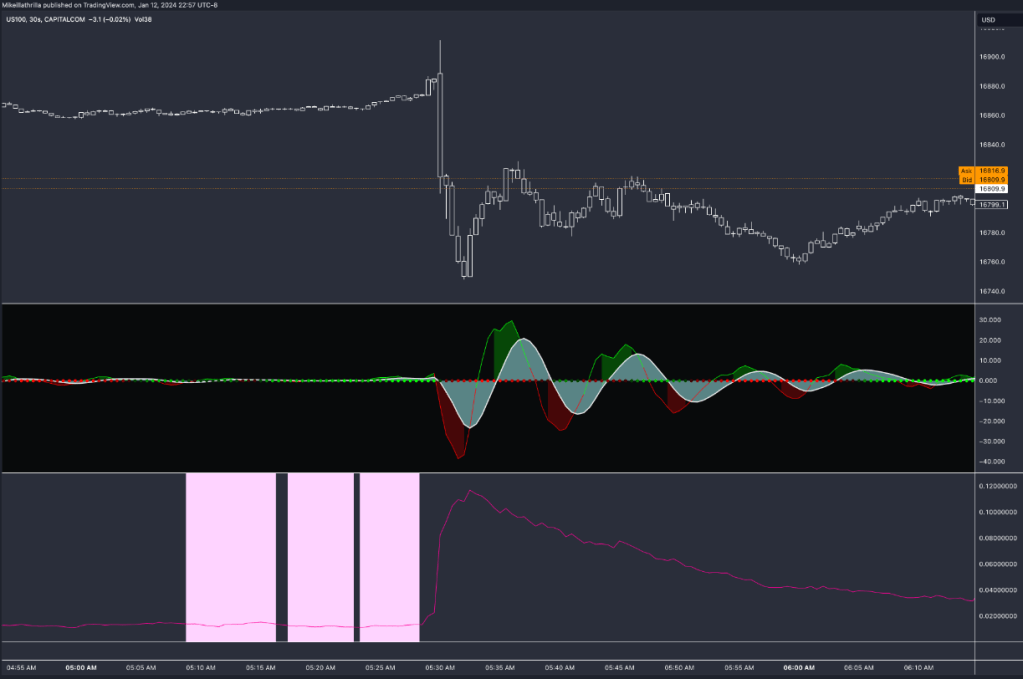
On the 30s timeframe, we get the best results. You can see multiple oscillations are captured as the market tries to discover fair value. I think this would work on high frequency. The orderbook data will have more clues. You might just want to wait for NATR to peak, and then capture the next oscillations.
Another way to look at this might be to find the timeframe for Voss where Voss has the expansion on the ATR oscillation/reversal or just a little after. Requires further study.
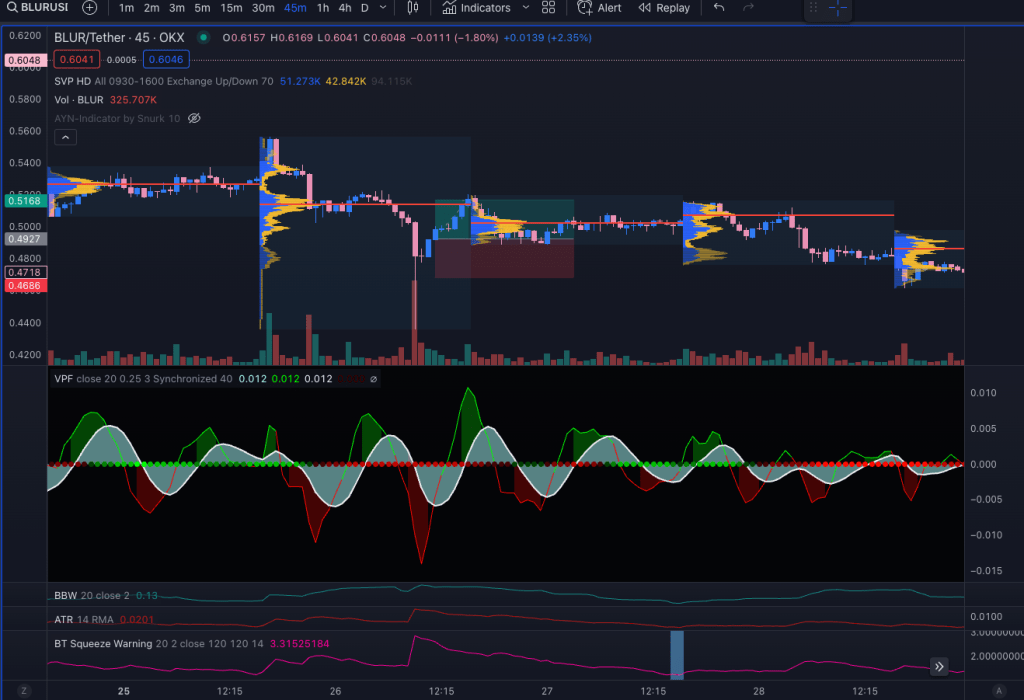
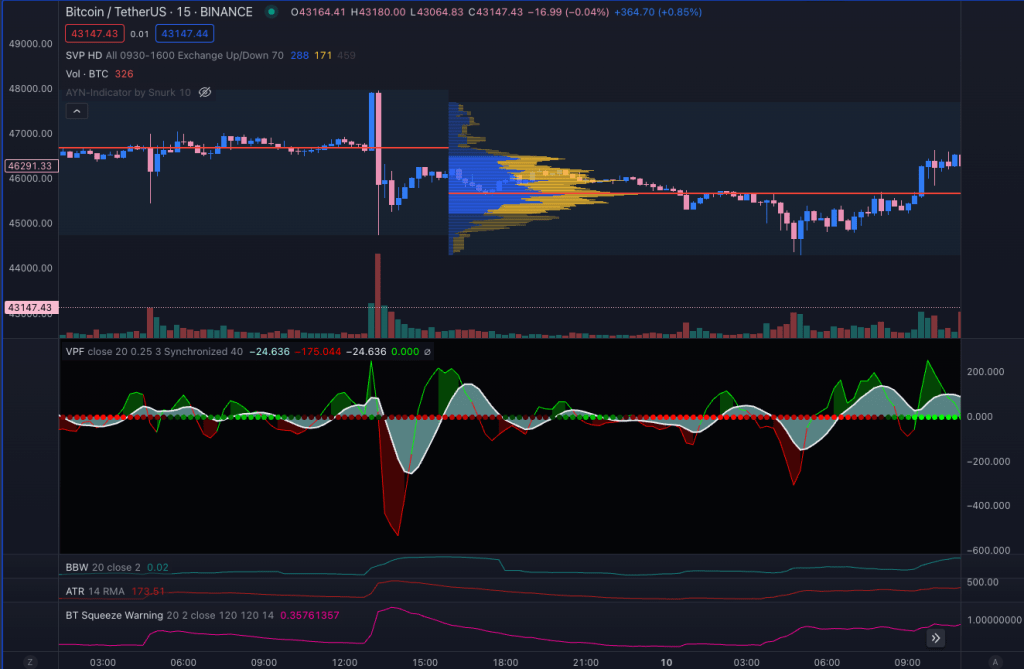
Efficient markets will have a lot less to capture (without some major catalyst immediately present), as you can see in BTC.


Leave a comment