
My first attempt to use RL for trading was probably three years ago. I was not a consistent or profitable trader. I’m at the point I can hold it together now, and my trading is a lot less about strategy and a lot more about psychology today. I have a Playbook with setups I can iteratively improve upon and quantify. I’ve logged somewhere around 7000 or 8000 hours of screen time now. I don’t intuit or guess much, I let the market tell a story now. It was hard to get here. The psychological aspect was the most difficult, to observe and understand my biases and how they harm my trading, and to start to produce a definable, quantitative approach to trading was and still is very challenging. We think we know what the market should do, and that is harmful. Anything can happen.
I was never able to produce a consistent/profitable model with RL, but I also didn’t have a consistent/profitable approach to trading. Now I do and I know what data to highlight for RL. I’ve had so much time to think about the way that I perceive the data that I’m ready to take another attempt at training a model. You learn as a human which indicators have signal, and the way that you look at the data. My first attempts were basically taking a smattering of indicators without much PCA and just throwing the whole thing at an agent. Attention/Transformers were starting to appear and I thought that would be enough to kind of “figure out” the problem space with a bunch of raw indicators. Every model I trained had a stark drop of profitability so I los interest eventually, especially with the brutally long cycle times. I was doing crazy stuff like hyper-opt tuning every run too. I’ll be a lot more systematic this time, and will attempt to train on a lot more data to prevent overfitting.
We need to do a few things to be able to train on lots of data tho:
- Select markets.
- Normalization
- Feature Engineering: Understand a strategy/approach that we want to highlight for the agent.
SELECTING MARKETS + TIMES
I’ll likely train the agent on indices first as I’ve spent so much time watching the ebb and flow of these. Until I’m testing, I won’t know which are easiest/have the most alpha – they are very competitive markets and so are some of the most difficult to compete in. My hypothesis is that alpha exists early and late in the day, and will be easy to compete for:
Institutional interest often appears pre-market. I’ll scope the agent in on the pre-market session and session open. I may not even train on the entire day, I’ll just focus on the kill zones, so the hour of of Europe into NYSE market hours, and then the NYSE open bell until about lunch. I may also try to train for the “retirement setup” into market close, and there are a few really good ways to quantify these and when they’re likely to occur. Because human traders flood in around the beginning and end of day, we’ll find more alpha in these “Kill zone” times.
Market internals/breadth information isn’t available in TradingView or any of the data sources I’ve looked at that are free, but I figured out how to manually do a lot of the internals calculations so we can highlight “iceberg” orders and other anomalous activity that improves our ability to spot big money coming into the market that makes the day trend. As a human trader, I’ve learned to play with two separate playbooks so I want the agent to have that information about the market internals to be able to catch trends and avoid mean reversion plays.
The markets I’m selecting are hard, but I believe I have enough edge in my experience to build a competitive agent.

Markets will tend to price in all data near-immediately, but humans are imperfect so we want to be trading against the humans, not the bots. We’ll loose against algos – we want to scope in on the times humans are likely to be trading.
NORMALIZATION
One of the problems I had in my first iterations was over-fitting. In order to get around over-fit, you’ve gotta train against a lot of data and it all has to be the same qualities/features. I may not end up using more than a single market to train/test with, but the conditions of the market shift so immensely that I’m sure I’ll have to figure out how to test against a lot of really competitive markets. BTC, Big Cap stock and Crypto, Indices etc. Less competitive markets have more alpha but I actually want to target the big markets as we’re gonna be making some big boy orders! We won’t be able to throw $1000000 orders at small cap markets without impacting the market, but we can do it with indices without denting the order book. I thought about trading only small caps but I’m gonna use my edge and try to compete with the big boys.
Regardless of how many markets I’m gonna train on, we still want a way of looking at the data is some standard way. Doing this work/research up-front will allow us to port the work to different markets more easily, and should reduce the training time and complexity of the model, and improve the results. https://arxiv.org/pdf/2009.12836.pdf
Indicators are all just statistic features of the data, so we’ll use what humans use to describe the degree of movement in a normalized way: ATRs.
ATRs are a rolling calculation used to describe the “Average True Range.” We’ll use the daily range, and roll an average over n periods. This should exist in ta-lib for us already, but it’s not hard to understand. Once we have the ATR for our n periods (eg 20 days) then we’ll be able to divide price by the ATR to get a normalized price. The calculations for TR and ATR are described here: https://www.investopedia.com/terms/a/atr.asp
The ATR itself will change, so order execution must account for the dynamic volatility, but from the agent’s perspective, it doesn’t need to care about much other than if it can capture n ATRs of not. On the order execution side, we can account for the risk based on the ATR itself.
FEATURE ENGINEERING
Now it gets gritty. This part is tricky and you can’t just throw a bunch of indicators at the agent and hope it learns something! We want the agent to have our playbook basically, to see the things we see. I’m guessing researchers just wholesale throw indicators at a model after doing some PCA but we’ve got a competitive advantage in that I have lots of human experience so I can theorize about which pieces of the data are significant and “roll them up” into alphas. We can hypothesize/test and check the effects one indicator at a time.
I theorize that proximity is more important than a value so some of the things I want to test are eg ATRs from a level rather than simply including the level. I’m thinking if I can roll up conditions I see as a human into boolean conditions I can likely illuminate features of the data. I do this already for myself with alerting, so I’ll continue to experiment and see what effect it has on the model’s performance.
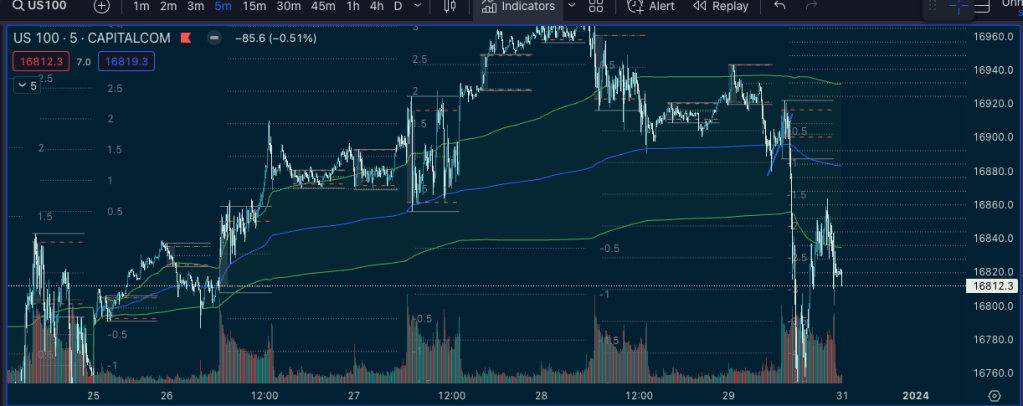
Most of the indicators I focus on will be volume-oriented. Where is it getting traded at. Support and resistance levels are visible in the volume profile information so I hypothesize keeping the most heavily traded areas tracked will contain some degree of alpha. You can see those areas are revisited and traded heavily. When the price starts to move away from a “Point of Control” (red) it can be a very large/violent movement. I caught the big one visible here on Friday 😉

VWAP is another strong contender. In a trending market the price will often bounce on that level as “fair value.” Institutional buyers can use that level in their buy programs to accumulate over days. They won’t care too much about the price, they’ll make huge orders and it moves the market so we want to see what they’re doing the way the are looking at it to be able to follow their movements. You can see in the 1 week anchored VWAP that the bounces on the VWAP are really clear. When it finally breaks to the downside, that correction is fast and hard. We want to catch those moves. These markets are very competitive so it’s not uncommon to see false breakouts etc.
VWAP anchored to different points in time gives us a good picture of “fair value” and will often act visibly like support/resistance.
Market times is another one. If you know me, you’ll know I use DR/IDR a lot to see the time of the day and the daily range. I wrote an implementation for DR/IDR in python, I just want to change how the data is presented in it a bit.
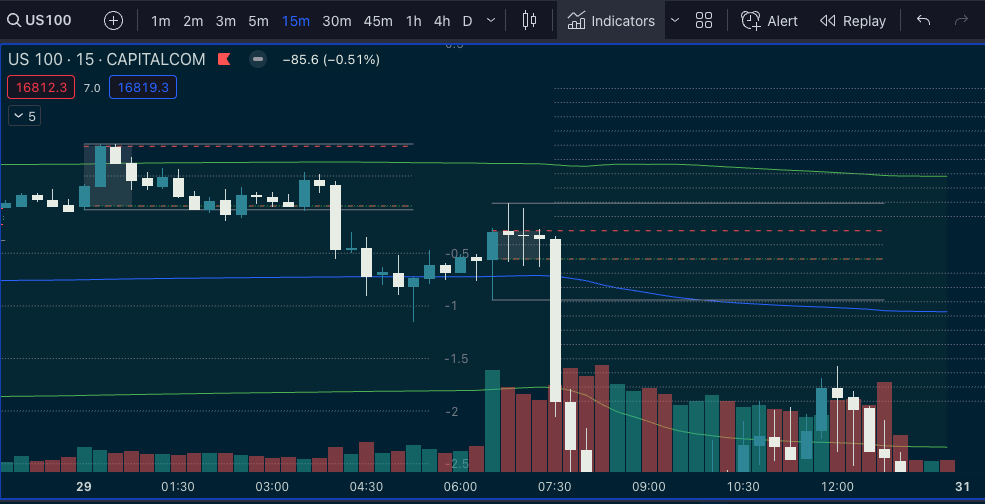
So we have some time information, some levels of interest, now we want to describe the phases of the market a bit. Market will generally have big explosive moves after consolidation. So that’s going to be the big-money plays, to focus on the big expansions. To quantify this, we can use indicators of volatility like Bollinger Bands (the width) or Keltner Channels.
If we study these indicators, we’ll notice that the width contracts, and then expands. You’ll see the market sessions, the tight consolidation between the sessions, and then expansion into open. This was a news day I suspect…

And you’ll note here that there is another interesting feature, and that’s that the explosive upward movement is followed by retracement – some degree of mean reversion. Either side of that trade is good to take, but I’ve found retracements are significantly more difficult to enter so I’ve been shifting my focus towards catching the expansions instead of retracements.
I’ll also want to include market internals information as it help to “categorize” the days. I won’t play retracement on days with extremes in the internals. I’m guessing the agent will make similar determinations. I’m not sure how these calculations will compare to the exchange data, but I can’t find any other way of acquiring in internals data apart from calculating it by hand.
It may be fortuitous to at least indicate if/when there are “red folder” events, or else avoid those days. They can be really wild, so it’s gonna be better to shut it down during big news. It’s not uncommon to see markets like Bitcoin move up and down percents within a minute or two on impactful news.
So this is roughly an outline of pieces that I want to explore. The difficult part will be understanding which features/transforms of the features yield the best results, but this gives at least a sketch of a plan for an approach to get going.


Leave a comment