
RVOL: A Key Indicator in Assessing Market Depth
RVOL plays a pivotal role in identifying the intensity of trading activity around an asset. A high RVOL, like in our MEMEUSDT example with an RVOL of +4, signals a deep market with significant volume behind the move. This is crucial in assessing the likelihood of an asset’s continuation in a trend versus its potential for a pullback. I have two playbooks, and I choose one depending on the market conditions. I use RVOL to understand the dynamics – I won’t try to follow a trend if the conditions are lean, and I won’t aim for retracement if the conditions are heavy. By using relative volume, we can see if the trading volume behind an expansion is unusual for that time of day.
In the screenshot, I have both a cumulative intraday view of RVOL (1 being the same volume as the last five days) and RVOL for the candles to see how much volume is on a candle relative to the average. These two views of RVOL help to see the overall dynamic, as well as a localized view of what’s driving an expansion.
The Setup
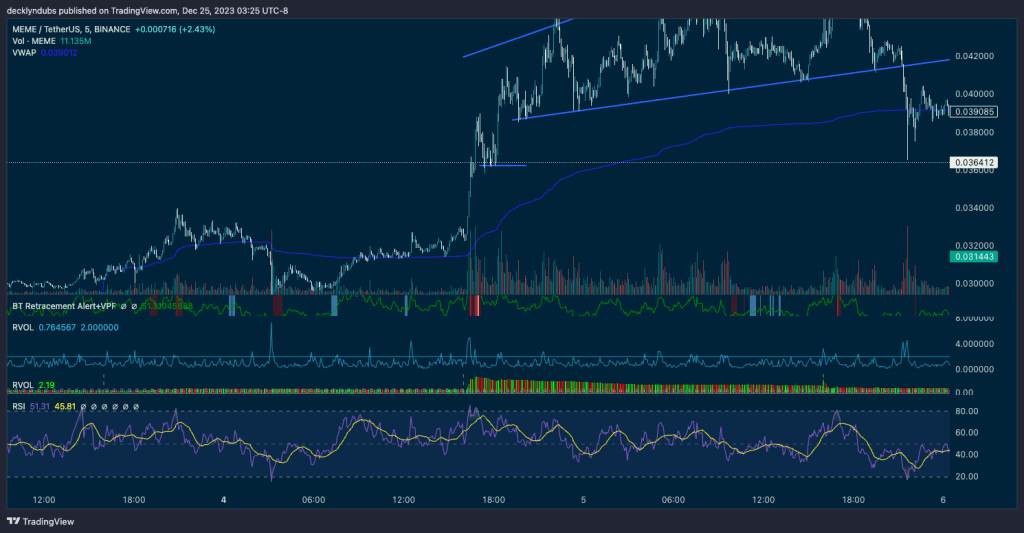
I received an alert for this setup (the red strip in my own BT Retracement Alert + VPF indicator), which uses a combination of RSI above 80 and Bollinger Band width at the highest level in the last 120 bars. It combines these with Ehler’s VPF to predict a reversal, and you’ll see that it predicts the retracement perfectly. I spent a lot of time refining this strategy, but it lost its edge once the market started to trend, and I struggled to read the market suddenly after passing two back-to-back prop challenges. I had to step back and take a break. I studied diligently to start to understand the different conditions, and that investment gave me back the edge I needed to trade in the green and regain my confidence. This is the kind of setup I would typically trade as a retracement setup and look for VWAP to be tested. It looks good for a short, except for the RVOL!
Contrasting High and Low Liquidity Scenarios
In trading, understanding the liquidity context is essential. During periods of high liquidity, as indicated by a high RVOL, assets are less likely to experience significant pullbacks and more likely to continue trending. Conversely, in low liquidity periods, the market is more prone to retracements. This knowledge allows traders to develop dual play strategies:
- High Liquidity Trends: In scenarios like our MEMEUSDT case, where high RVOL suggests a strong market, traders might lean towards strategies favoring trend continuation.
- Low Liquidity Pullbacks: Conversely, periods of low RVOL suggest lower market depth, indicating a higher probability of retracements, thus favoring pullback strategies.
Integrating Bollinger Bands and RSI for Refined Analysis
The interplay of RVOL with Bollinger Bands and RSI enhances the precision of these strategies. A high Bollinger Band width indicates market expansions and activity, often leading to retracements, especially in low liquidity markets. The combination of these indicators with RVOL provides a more comprehensive view, allowing traders to adjust their strategies according to the market’s liquidity state.
Confirmation Techniques for Added Safety
When considering short setups, reliable confirmation techniques are vital. Observing multiple wicks in a straight line can provide a safer entry point. In the MEMEUSDT example, this confirmation, coupled with high RVOL, suggested a strong likelihood of trend continuation, rather than a retracement.
The candlestick setup on the retracement has multiple taps on a level – that’s the level I’d look to break to enter a high-probability short. But you can see RVOL remains quite high, and this level is maintained as a buy wall. If that line broke, I’d short it right away, but it’s held up. I picked this tip up from SMB and use it often for confirmation.

These signals prevent me from taking a losing trade – this isn’t a short to take with RVOL being so high, not without a plethora of confirmations. The price continues to move up for a day.
Conclusion: Tailoring Strategies to Market Liquidity with RVOL
RVOL, when used in conjunction with other signals like exchange-VOLD and changes in total market cap, offers traders a sophisticated tool for understanding market dynamics. Whether facing a trending market or a choppy fearful one, RVOL aids in choosing the right play for the setup. I’ve been able to use these insights to make significantly better trading decisions lately. As an example, here’s a heavy short catching the entire recent pullback on the S&P. The whole thing, like magic.


Leave a comment