
Navigating the ever-changing landscape of the stock market requires not only acumen but also the right tools and strategies. For traders targeting indices like the S&P 500 (SPY), one such approach involves utilizing Volume Difference (VOLD) and advance-decline data to differentiate between trend days and inside days. This distinction is crucial in choosing the appropriate playbook and can be a game-changer in enhancing trading performance, especially in the context of the S&P/SPY. Because institutional buyers will hide their positions (see: Iceberg Orders), VOLD helps to identify if big buyers are buying or selling in the market.
Understanding VOLD and Advance-Decline in TradingView
Some platforms like ThinkOrSwim have VOLD, but TradingView does offer access to these metrics. By using the symbols USI:UVOL and USI:DVOL, traders can access the NYSE exchange volume data. This data is instrumental in calculating the Volume Difference (VOLD), which is achieved by subtracting the down volume (DVOL) from the up volume (UVOL). Additionally, the VOLD ratio can be determined through division, offering deeper insights into market trends.

The Significance of Trend Days vs. Inside Days
In the realm of index trading, days typically fall into two categories: trend days and inside days. Trend days, which account for about 10% of trading days, are characterized by a strong directional movement. Spotting these trend days is crucial as they set the tone for aggressive trading strategies, distinct from the more cautious approach suited for inside days.
Strategy Application: Why Identifying Day Types Matters
- Avoiding Fades on Trend Days: On trend days, attempting to ‘fade’ or trade against the prevailing trend can often lead to losses. Recognizing a trend day early helps traders align with the market’s direction, enhancing the chances of profitable trades.
- Selecting the Right Playbook: Each day type demands a specific trading approach. By accurately categorizing the day as a trend day or an inside day, traders can apply the most suitable strategies, whether it’s capitalizing on momentum during trend days or playing ranges on inside days.
In this article, we dive deep into the mechanics of using VOLD and advance-decline data to categorize trading days effectively. We’ll explore practical examples and strategies, specifically tailored for trading the S&P/SPY, to demonstrate how these tools can significantly impact your trading decisions and results. Join us as we unlock the potential of these indicators to refine your trading approach and align more closely with market dynamics.
Analyzing VOLD for Market Insights
Understanding VOLD (Volume Difference) is key to grasping market sentiment on any given day. When UVOL (up volume) significantly outweighs DVOL (down volume), it’s indicative of a bullish sentiment, possibly flagging a trend day. Conversely, a higher DVOL suggests bearish sentiment, which could also signal a trend day, but in the opposite direction.
- Calculating VOLD: Use the formula VOLD = UVOL – DVOL. This simple calculation, available through TradingView’s USI:UVOL and USI:DVOL, provides a clear picture of the overall market volume trend.
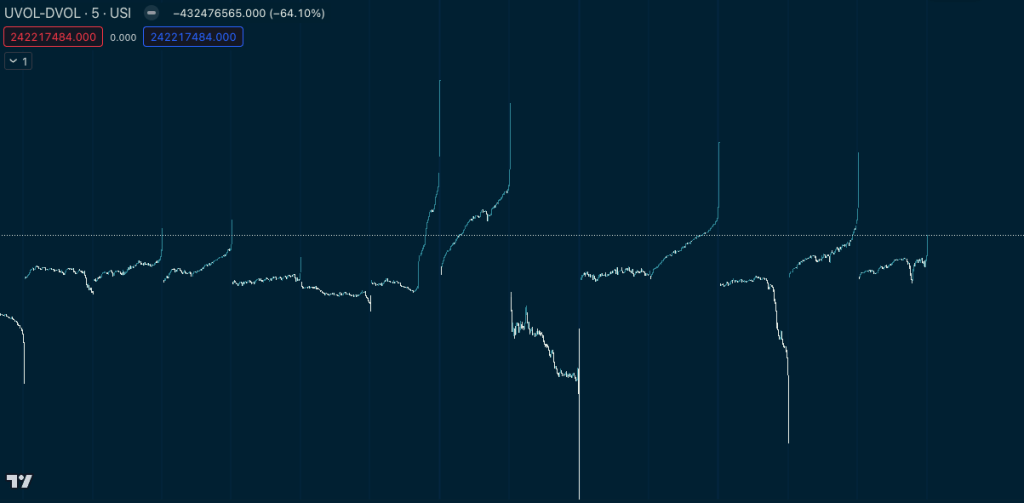
- Interpreting VOLD Ratio: The VOLD ratio, calculated by UVOL / DVOL, offers further clarity. A ratio significantly greater than 1 indicates strong buying pressure, while a ratio much less than 1 suggests dominant selling activity. VOLD ratio makes it easier to spot outlier days early in the session.
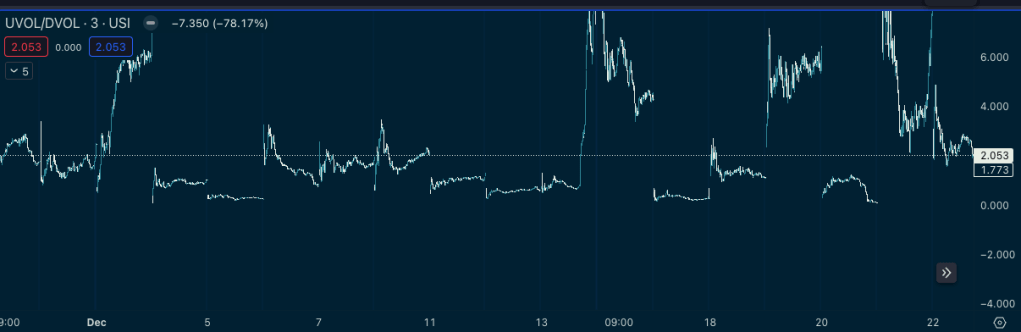
VOLD ratio gives a clearer picture. VOLD over 5 that is sustained helps spot institutional presence.
You can inverse the VOLD ratio calculation (DVOL/UVOL) to get a better view for exchange-wide sell-side pressure.
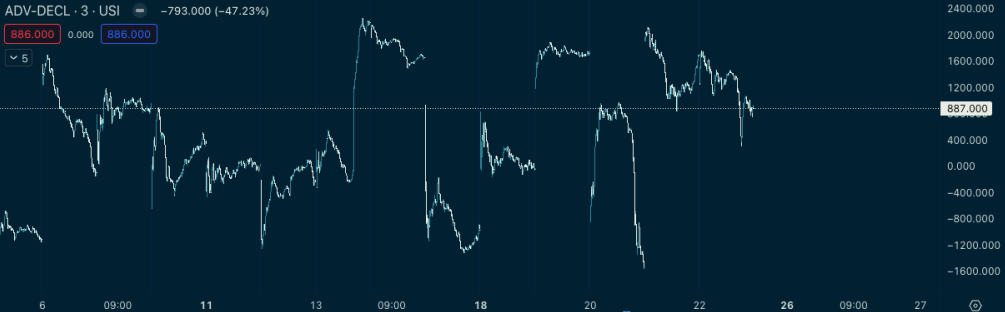
The Role of Advance-Decline Data
Advance-Decline data complements VOLD by providing a supportive view of market breadth. It involves the number of advancing stocks versus declining stocks. A day with a high number of advancing stocks compared to declining ones could indicate a bullish trend day, and vice versa. If a single large-cap stock is getting bought, it may cause false-signal on VOLD, where Advance-Decline will give a view that is more balanced.
- Identifying Trend Days: Look for a significant discrepancy between advancing and declining stocks. A large gap often signals a strong trend day.
- Application in S&P/SPY Trading: For S&P 500 traders, this data is crucial. The SPY, being a broad market ETF, is particularly sensitive to these overall market trends.
Strategies for Trend Days and Inside Days
- Trend Days: When VOLD and advance-decline data point towards a trend day, align your strategies accordingly. This might mean following the trend with momentum trades or breakout strategies.
- Inside Days: On days when the market shows no clear direction, it’s often safer to employ range-bound strategies, like trading bounces off support and resistance levels.
Avoiding Common Pitfalls: The Case Against Fading Trend Days
- Risks of Fading: On trend days, ‘fading’ the market – or betting against the trend – can lead to significant losses. Recognizing a trend day early helps in aligning with the market movement rather than against it. The worst losses I’ve had are when I get stuck on the wrong side of a trade in a trend day.
- Utilizing Stop-Losses: Even with the best analysis, markets can be unpredictable. Employing stop-losses ensures you limit losses even when your assessment of the day type is off. Ensure you stick to your stop losses – VOLD can help you identify trend days, but you’ll still observe trend days without an outlier VOLD ratio.
Conclusion: Refining Your Trading Approach
The integration of VOLD and advance-decline analysis in your trading can substantially enhance your ability to categorize and react to different market conditions. Especially for those trading indices like S&P/SPY, these tools offer a refined lens through which the market can be viewed and understood. Remember, the key to success in trading is not just in the strategies you use but in how you adapt them to the market’s rhythm. Embrace these tools, and watch as your trading evolves to a more sophisticated, data-driven approach.


Leave a comment