
In the world of trading, the ability to spot potential retracements can be a game-changer. One powerful tool that traders have at their disposal for this purpose is the Relative Strength Index (RSI). While RSI is commonly used on a single time frame, its true potential is unleashed when applied across multiple time frames. This blog post is dedicated to exploring how you can harness the RSI across different time frames to identify more robust and extended conditions, ultimately improving your ability to find profitable retracements.
The RSI, a momentum oscillator that measures the speed and change of price movements, is traditionally used to identify overbought or oversold conditions. However, when applied across various time frames – from shorter to longer – it provides a more holistic view of the market’s momentum and potential reversal points. This multi-time frame approach not only enhances the accuracy of identifying retracements but also aligns your trading strategy with the broader market trends, reducing the risk of false signals.
In this post, we’ll delve into the intricacies of using RSI in a layered time frame analysis. We’ll start by understanding the basics of RSI and its typical application in a single time frame. Then, we’ll expand our horizon, illustrating how to synchronize RSI readings across multiple time frames – from intraday charts to daily and weekly charts. By the end of this guide, you’ll have a comprehensive understanding of how to use RSI to pinpoint high-probability retracement opportunities, align your trades with the dominant market trend, and make more informed trading decisions.
Whether you’re a seasoned trader or just starting, this post will equip you with a nuanced strategy to use RSI more effectively in your trading toolkit. So, let’s dive in and unlock the potential of multi-time frame RSI analysis for finding those lucrative retracements.
The Power of RSI in Single Time Frame Analysis
Before we explore the multi-time frame approach, let’s first solidify our understanding of RSI in a single time frame. The Relative Strength Index (RSI) is calculated based on the average gains and losses of a stock or asset over a specific period, typically 14 periods. An RSI value over 80 often indicates that an asset is overbought, while a value under 20 suggests it’s oversold. This basic premise helps traders identify potential reversal points within a particular time frame. Don’t use 70 and 30.
Don’t use 70 and 30. Use 80 and 20.
Expanding the Horizon: Multi-Time Frame RSI Analysis
Now, let’s expand our view. The true magic happens when we apply RSI across multiple time frames. Imagine observing RSI not just on a daily chart but also on weekly and monthly charts. This broader perspective allows us to see if a potential overbought or oversold condition aligns across different time frames, significantly increasing the reliability of the signal.
Step-by-Step Approach:
- Start with the Shorter Time Frame: Begin your analysis with the time frame you’re considering (e.g., 5m.)
- Check the next Timeframe up: Look up one time frame and ensure you see a confirming signal. You risk being on the wrong side of the trade if it’s not extended there.
- Check Market Internals and Breadth: You don’t want to fade a trend day, so ensure that the market is going to stop. There are days the market will not retrace, so you should look for broad confirmation that the day is likely to be inside.
- Find entry signal: There are numerous ways to find the entry signal. My favorite way is to look for two or three wicks that hold a support level, and enter as soon as you see a wick under.

Finding High-Probability Entries: Combining RSI with Other Indicators
While multi-time frame RSI analysis offers a robust framework for identifying potential retracement opportunities, the precision of your entries can be significantly enhanced by incorporating other technical indicators. This holistic approach ensures that you’re not just relying on a single piece of data but are considering the market’s dynamics from multiple angles.
1. Volume Analysis:
Volume is a key indicator of the strength behind a price move. A declining volume during an overbought or oversold condition on RSI can signal a weakening trend, hinting at a potential reversal. For instance, if the RSI is overbought and volume begins to taper off, it may indicate that buying pressure is exhausting, setting the stage for a bearish retracement.
2. Bollinger Bands:
Bollinger Bands are excellent for identifying the market’s volatility. When the price touches the upper Bollinger Band in an overbought condition on the RSI, it often signals an overstretched market, suggesting a potential pullback. Conversely, a touch of the lower Bollinger Band during an oversold RSI condition can indicate a potential bullish bounce. I personally use statistic outliers in a recent window to find expansions that are likely to be violent enough to retrace. I combine this with RSI to “screen” for setups.
3. VWAP (Volume Weighted Average Price):
VWAP serves as a benchmark for the average price a security has traded at throughout the day, based on both volume and price. It is often used as a trading benchmark. If the price is far above or below VWAP during extreme RSI conditions, it might signal an unsustainable price move, suggesting a possible retracement towards the VWAP. You want the trade to be moving towards Vwap in session if it’s a short term retracement, especially if it is rejecting a higher timeframe Vwap.
4. Identifying Key Levels:
Visible levels of support and resistance, and pivot points validate RSI signals. For example, if an overbought RSI coincides with a strong resistance level, it could reinforce the likelihood of a retracement. High probability chart patterns like rising/falling wedges or horns on high timeframes can help to find strong, high probability entries.
5. Indicator Confluence:
The concept of indicator confluence means using multiple indicators to confirm the same signal. For instance, if the RSI is showing overbought conditions, volume is declining, and the price is at the upper Bollinger Band and a historical resistance level, you have multiple factors aligning to suggest a potential short entry.
Example Trade Setup:
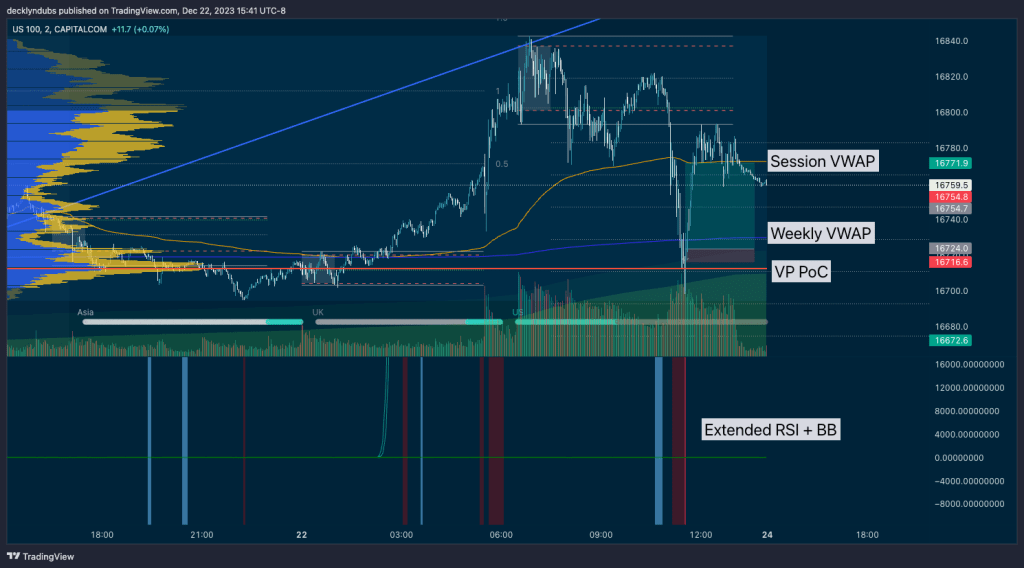
Here is a scenario from today Friday Dec 22 trading Nasdaq (US100 CFDs) where the multi-time frame RSI analysis indicates an oversold condition on 1m, 2m, 5m charts close to the end of the trading day. The price is significantly below the session VWAP, and falls to the session volume profile’s Point of Control from Asia (eg the price that it has traded the most volume at.) . It also breaks through and the weekly VWAP and then returns over it. This confluence of indicators presents a compelling case for a bullish retratement towards the session VWAP.
An alert indicated me that this trade was here (shown at the bottom) which uses both the RSI <20 and an outlier width on Bollinger bands.
In Summary:
By integrating RSI with other technical indicators like volume, Bollinger Bands, VWAP, and key levels, you not only enhance the reliability of your entries but also align your strategy with a more comprehensive understanding of market dynamics. This multi-indicator approach allows for a more nuanced and informed trading strategy, leading to potentially higher-probability trading setups.


Leave a comment